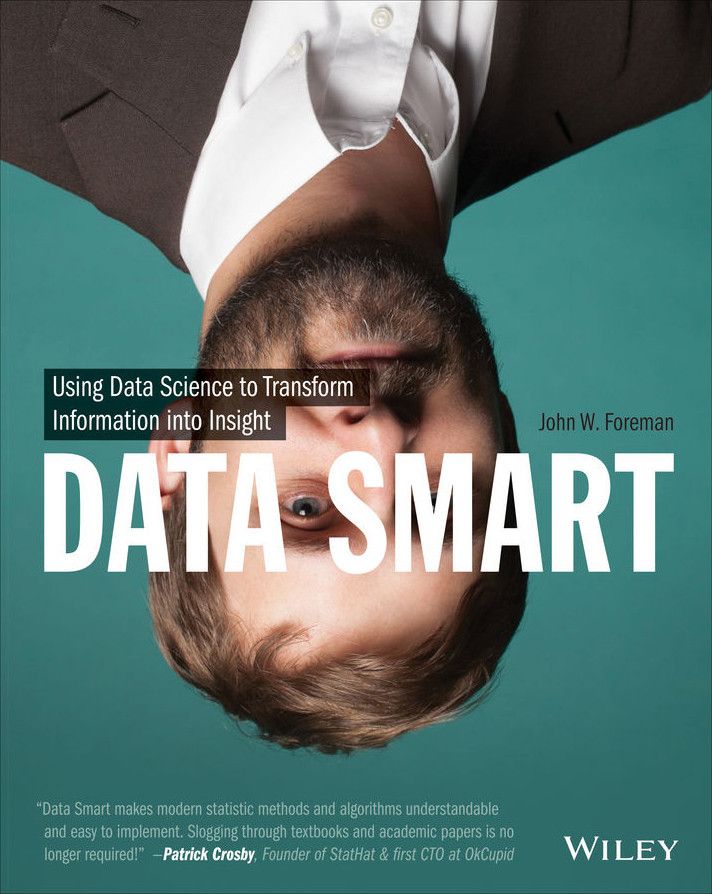
Data Smart by John W Foreman
This book did my head in. But I am grateful for the knowledge, and I have made a Github repo for you if you just want to look at the code.

Omooo! This book shattered my mind. It took me two and a half months to finish reading it, and after doing that, my conclusion is that Data Science is not for the faint of heart (or mind).
The book, Data Smart, by John W Foreman, former Chief Product Officer at Mailchimp, introduces the reader to Data Science concepts in an interesting way. By walking the reader through how to implement various analytics techniques in Excel (the spreadsheet software), John attempts to simplify the process and make the logic accessible to a business audience.
But unfortunately for me, I was neither well versed in Excel nor in the concepts being taught on top of it, so the whole enterprise was a challenge. First of all, even though the book suggested some open-source alternatives, I felt that I had to get Excel to follow along. I did try using Numbers for a while, but some of the features I needed weren't supported. So I waited until I could get Excel for Mac. At this point, I had to start reading the book all over again (and that is where my count of two and a half months begins).
So once I had Excel, reading the book flowed a lot better, but still understanding the concepts did my head in. At a point, I stopped trying to implement the step-by-step instructions, and instead decided to just follow along with the pre-prepared workbooks available on the book's website. This reduced some of the learning headaches but also meant that if you asked me to replicate the exercises, I wouldn’t be able to do it.
That said, I continued to slough my way through the book, and after much reading and even less understanding, I made it to chapter 10 (the final chapter of the book). Now chapter 10 felt like a blessing because in chapter 10 the book finally started speaking (one of) my languages: R. The R programming language is preferred by statisticians and data scientists worldwide because it focuses on solving their problems. It has a wealth of libraries that simplify the work that they do, and it also has many native functions that do the same.
In any case, leaving Excel and moving to R, was a blessing. But as it turned out, doing much of the same work that I had spent the last 9 chapters reading about, in R was trivial. It came down to importing your data, importing one or more of the existing packages for doing the work, and running a few functions. In fact, chapter 10 alone implemented the whole previous 9 chapters, in one.
Frankly, I understand why I had to go through the pain of the previous chapters. It was because using R both simplifies and obfuscates much of the work that is done to arrive at the answers you want when performing data analyses. So if John had taught us how to do this stuff in R, to begin with, we the readers wouldn't have learnt half as much as we needed to, to understand the processes he was teaching.
But honestly, I didn’t understand half the processes he taught in Excel anyway and would have much preferred to be learning to code in R. I am grateful that I now know how K-means clustering works, and Naive Bayes, Time Series Forecasting, and Identifying outliers works, but all in all, I could have done without the headache of replicating these complex analyses in Excel.
So if you’re like me and you just want to look at the R code, I have gone ahead and created a Data Smart repo on Github which contains the code from chapter 10 and some explanations. You might need to jump back into previous chapters for deeper context but the code you need to achieve the same results is all captured here, in my public GitHub repository. So you can just clone it, and have a look.
